Salexa Sales Performance Dashboard
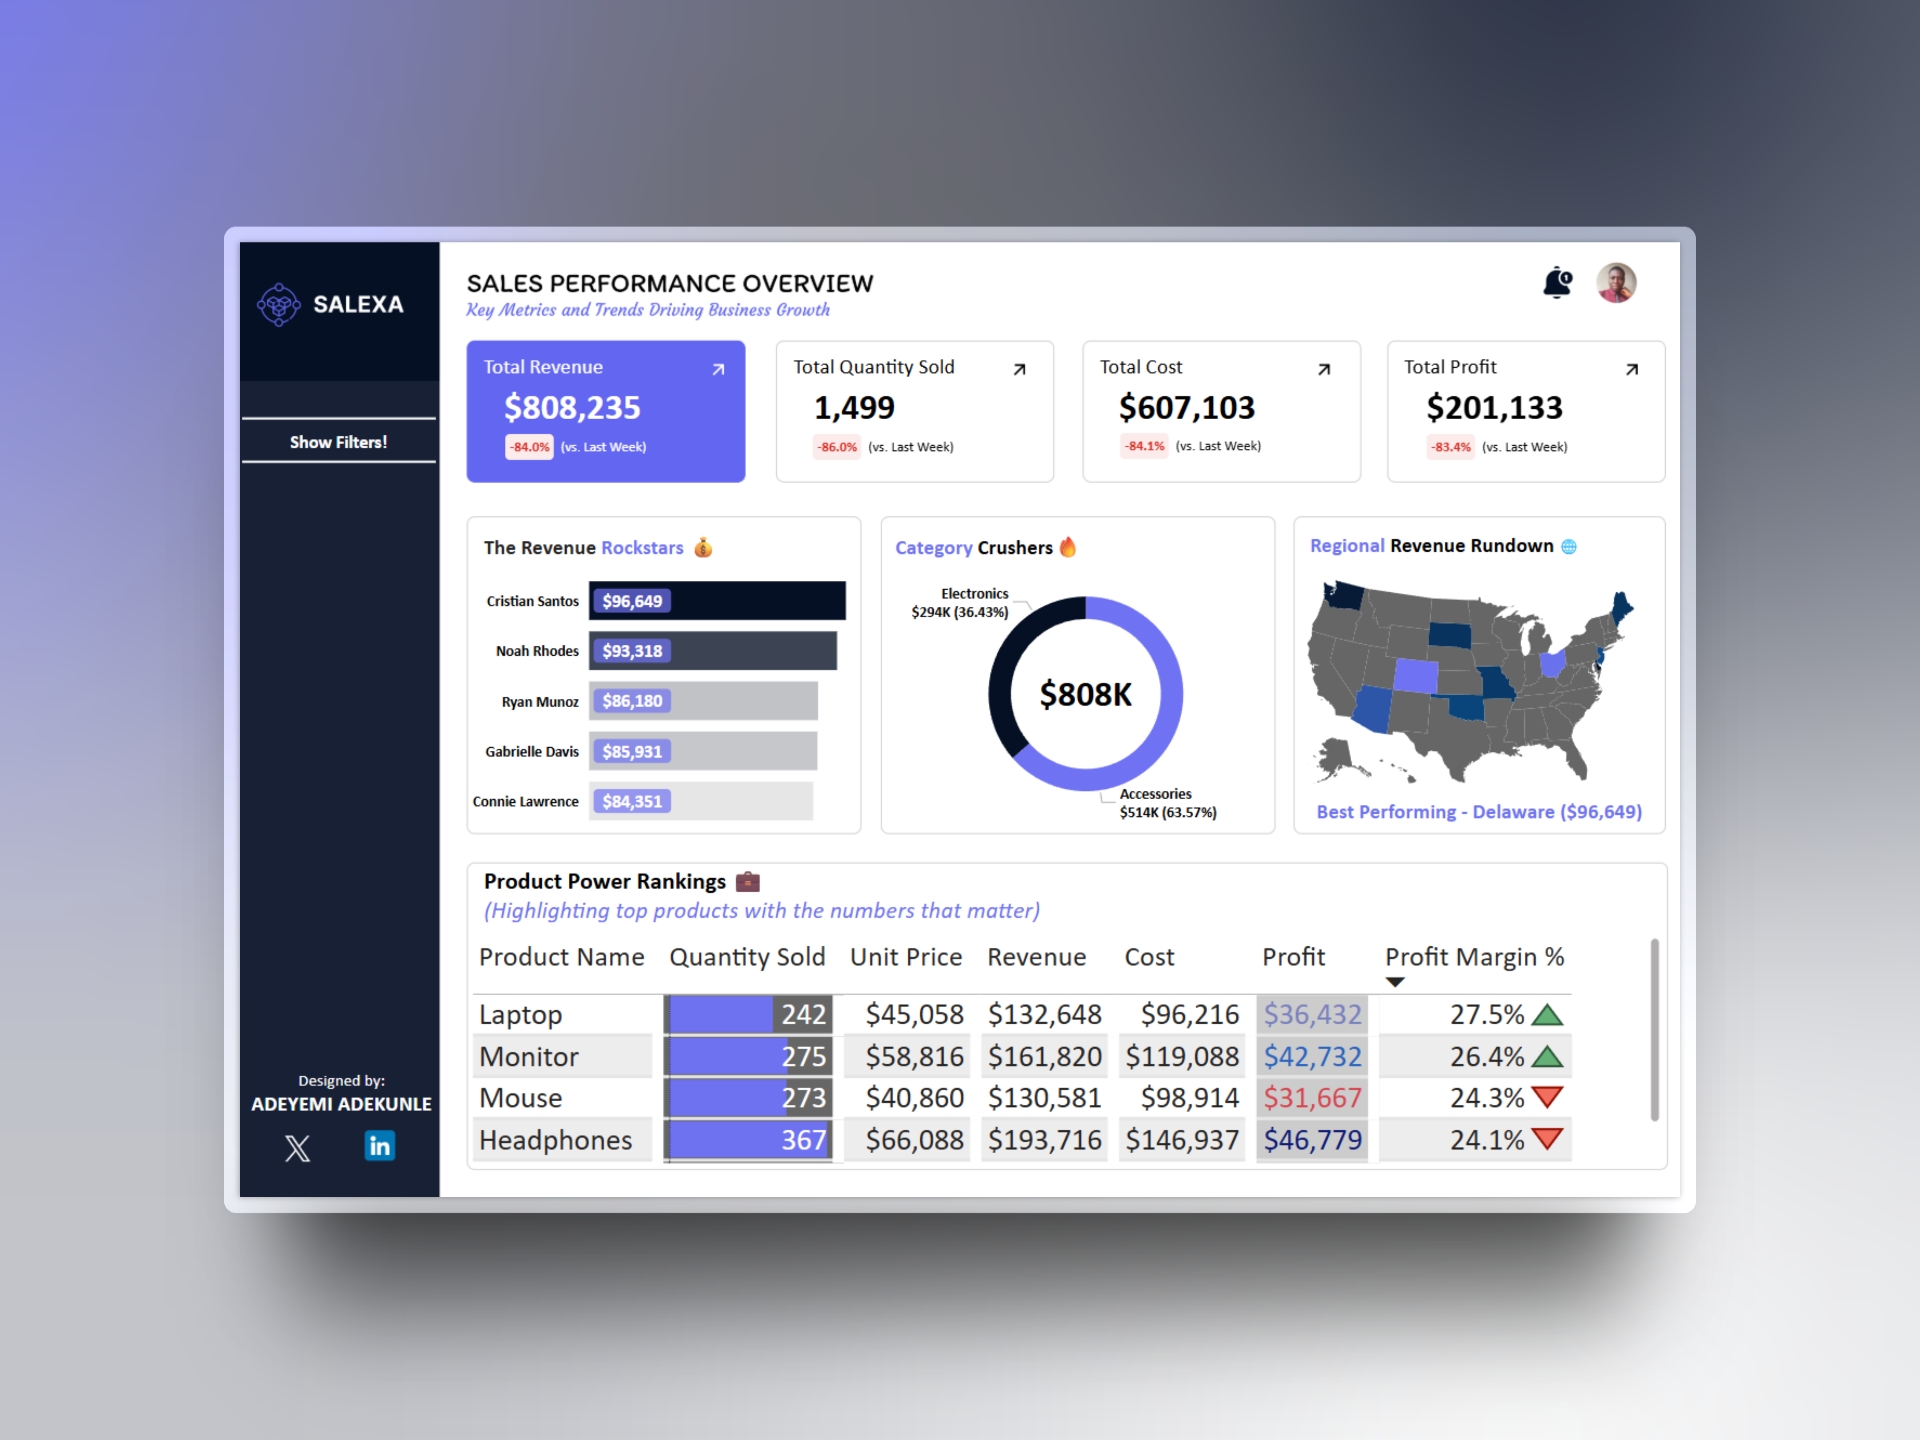
This project analyzes sales revenue, cost, and profit across products, regions, and categories to identify top performers and areas for improvement.
Tools Used: Microsoft Power BI, Figma.
This project analyzes sales revenue, cost, and profit across products, regions, and categories to identify top performers and areas for improvement.
Tools Used: Microsoft Power BI, Figma.
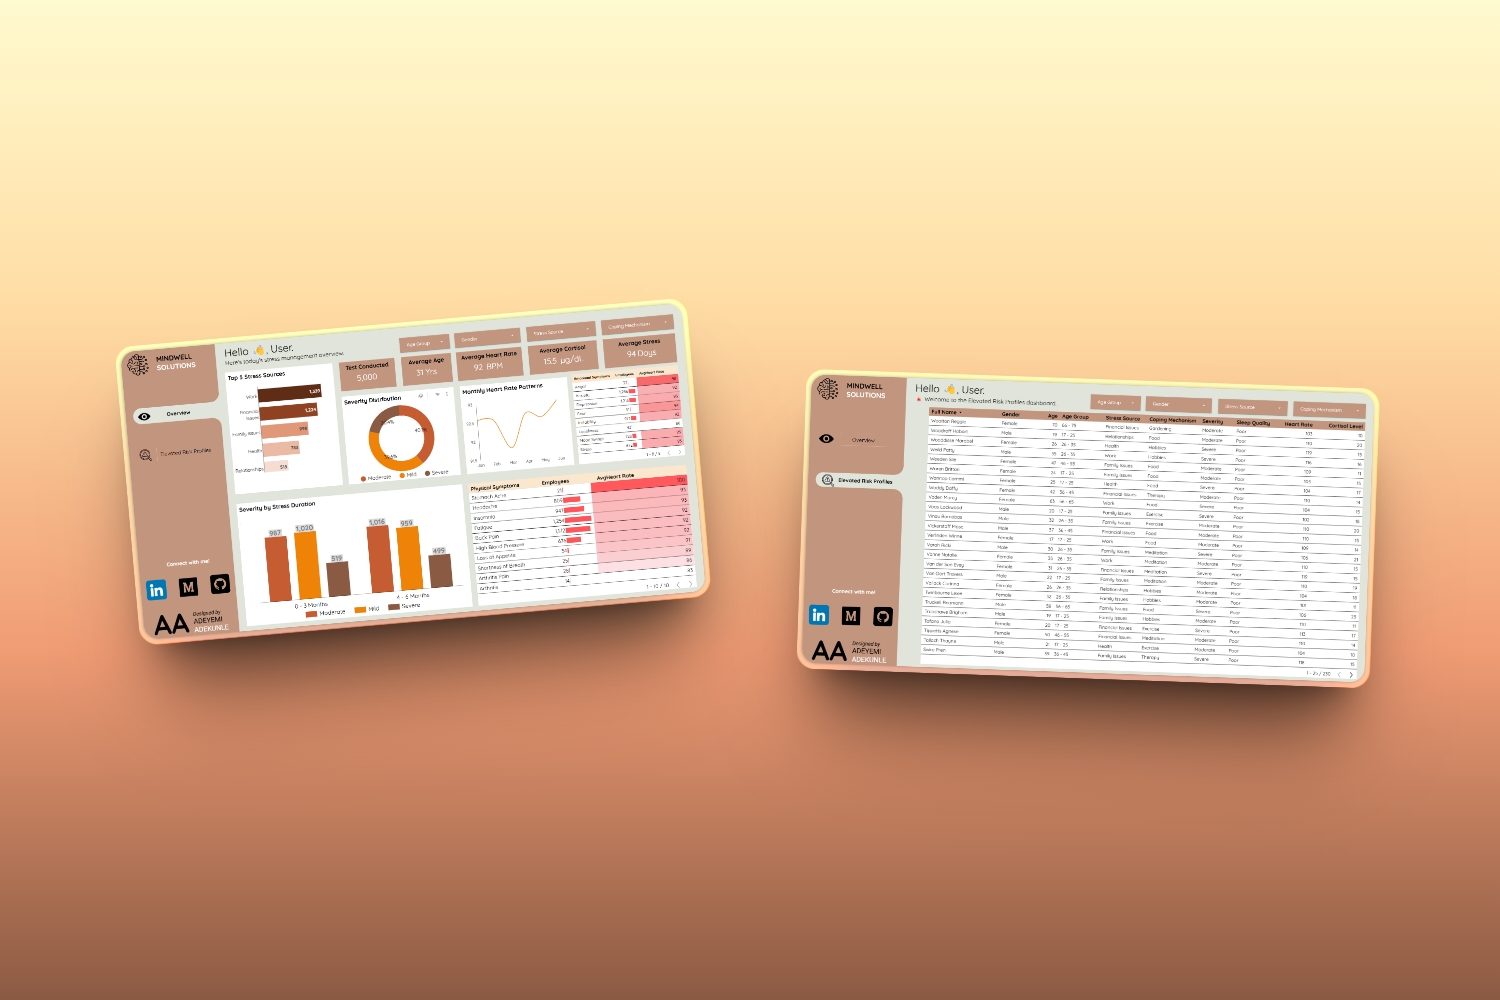
This project analyzes stress levels, heart rates, and elevated risk profiles among employees to identify potential health risks and areas for intervention.
Tools Used: Ms SQL Server, Looker Studio, Figma

This project focuses on analyzing the customer complaints dataset of Bank of America (BoA) from 2017 to 2023 to uncover trends and recurring issues.
Tools Used: Microsoft Power BI.

The project focuses on addressing France's trade deficit by exploring strategies to boost exports, reduce imports, and enhance economic productivity.
Tools Used: Microsoft Excel, Microsoft Power BI.